Features
MIRA combines deep learning efficiency with professional microscopy standards to provide a complete workflow for microbiological analysis.
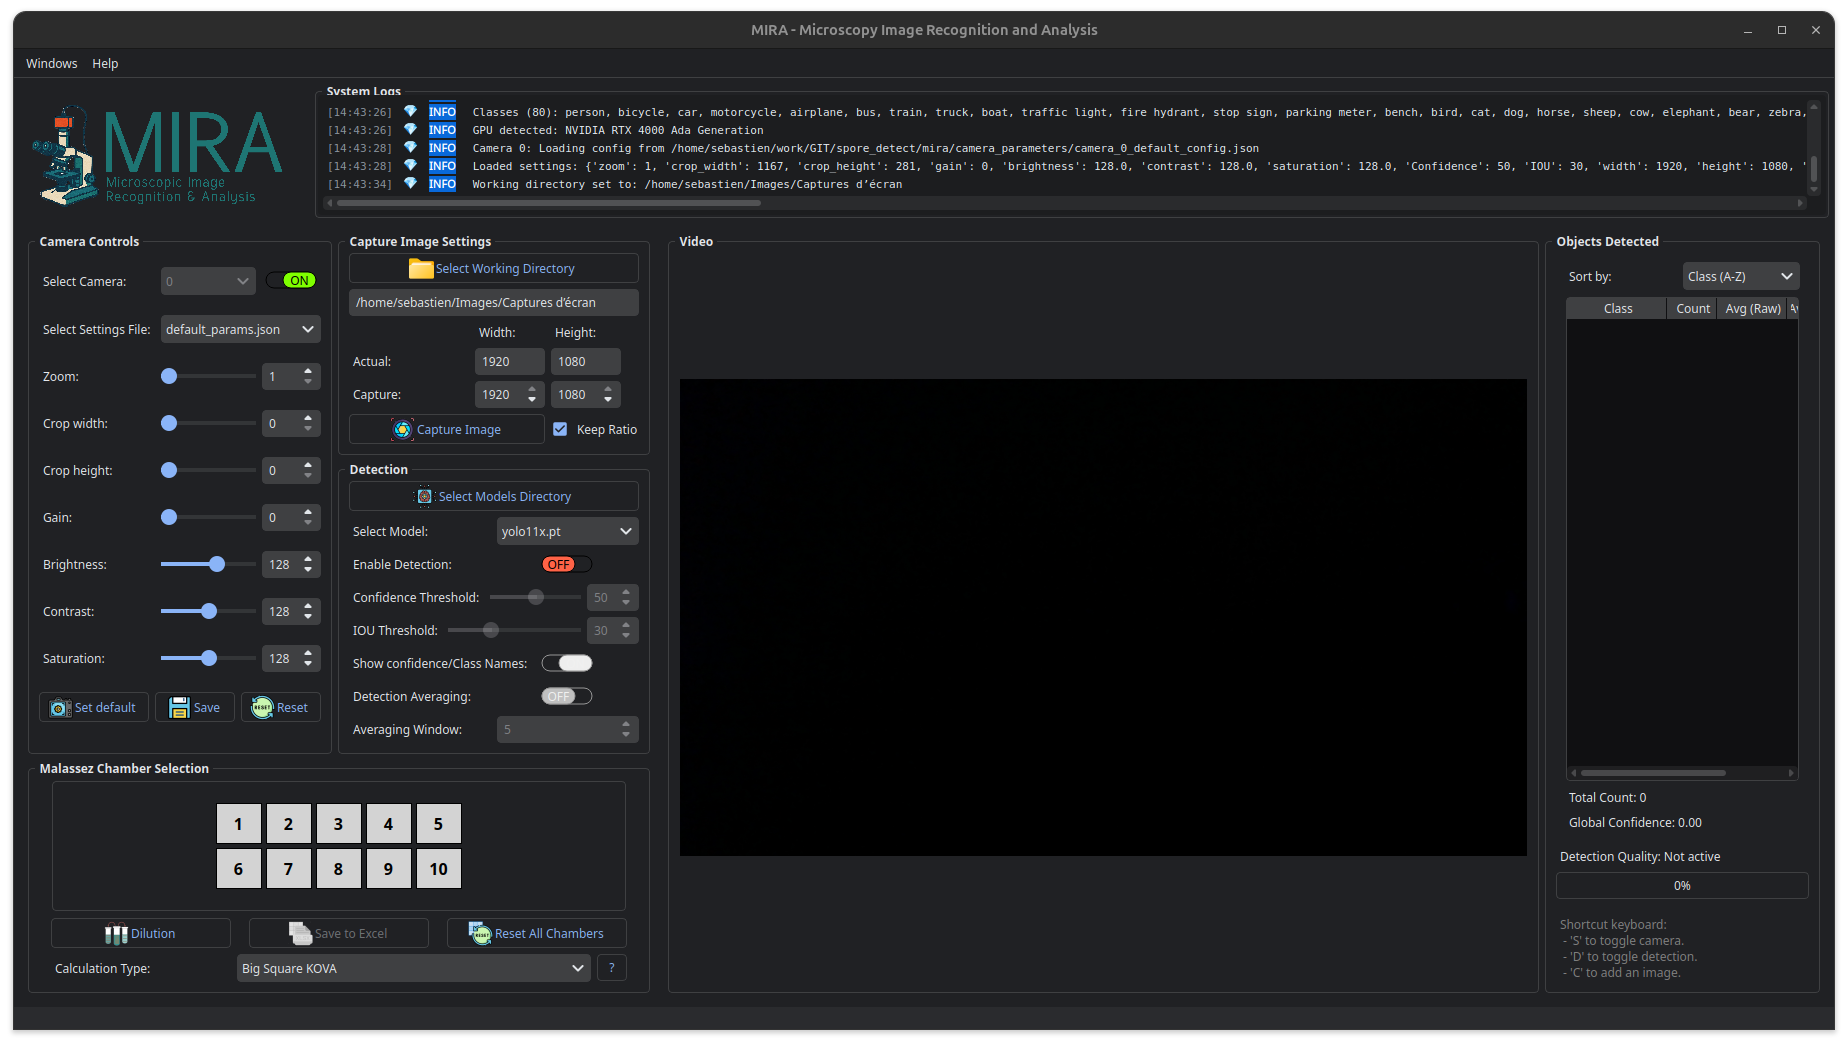
YOLO-powered analysis
Live Preview: Instant detection overlay on the video feed.
Tracking: Hardware-optimized tracking (BotSORT on GPU, ByteTrack on CPU) with dense/sparse modes.
Custom Thresholds: Precise control over Confidence and IoU (Intersection over Union).
—
Advanced Camera Control
MIRA is designed to work with high-end industrial sensors, providing granular control over your image acquisition.
Category |
Capabilities |
|---|---|
Image Tuning |
Digital zoom (1-10x), Crop, Brightness, Contrast, Saturation. |
Optimization |
Automatic resolution detection and FPS optimization for smooth preview. |
Crop |
Width and height crop sliders to focus on a specific region of the frame. |
Hardware |
Optimized for ArduCam 20MP (5472×3648 resolution). |
—
Professional Sample Management
The software includes built-in logic for the most common counting chambers used in laboratories.
Interactive 10-chamber grid (5×2 layout) with:
Calculation Methods: 40 rectangles (×2,500), 20 rectangles (×5,000), or Full Grid — 100 rectangles (×1,000).
Visual Tracking: Color-coded status for each chamber (empty, in-progress, complete).
Dilution: Per-chamber serial dilution factors, applied automatically to the final concentration.

Dedicated support for KOVA counting systems:
Big Square KOVA: ×5,000 multiplier (2 big squares per image).
Small Square KOVA: ×90,000 multiplier (2 small squares per image).
—
Data Export & Analysis
MIRA doesn’t just count; it provides a comprehensive statistical report ready for publication or QC records.
Export date, calculation method, formula, and multiplier.
Per-object data: class, bounding box, confidence, surface area, and timestamp.
Per-image aggregation: spore counts by class, surface statistics (Mean, SD, SE, CV%), and average confidence.
Per-chamber results: Spores/mL, Titer/mL (with dilution), total counts, and quality metrics.
📂 Preview Excel Export Structure
The exported .xlsx file contains 4 sheets:
Metadata: Export date, calculation method, formula, and multiplier used.
Raw Data: Per-object details — class, bounding box, confidence, surface area, and timestamp for every detection.
Detection per Image: Per-image aggregation — spore counts by class, surface statistics (Mean, SD, SE, CV%), and average confidence.
Summary: Per-chamber results — total spores, average per image, Spores/mL, Titer/mL (adjusted for dilution), and surface/confidence statistics.
—
User Interface & Workflow
S : Toggle Camera ON/OFF
D : Toggle Detection
C : Capture Image
Dark/Light Modes: Automatic OS detection (Windows, macOS, Linux) or manual toggle.
HiDPI Support: Native high-DPI scaling for 4K/Retina displays.
Resizable Panels: Drag the splitter to resize the detection results panel.
Logging: Real-time color-coded system logs for debugging.
Tooltips: Context-sensitive help on every widget.
Save/Load: Store camera settings (gain, brightness, contrast, zoom) as named profiles.
Default Profile: One-click restore of your preferred configuration.
Per-Camera: Profiles are tied to individual camera devices.